Report Gallery
Every Trailblaze run produces a rich, replayable session. The reports below are not
mockups — they are generated automatically by Trailblaze’s own CI on each push to
main, exported straight from the example and showcase trails in this repository and
embedded here by the docs build — one per platform (Android, iOS, web). What you see is
exactly what your agent or CI produces locally with trailblaze report.
Three export formats are shown for each trail:
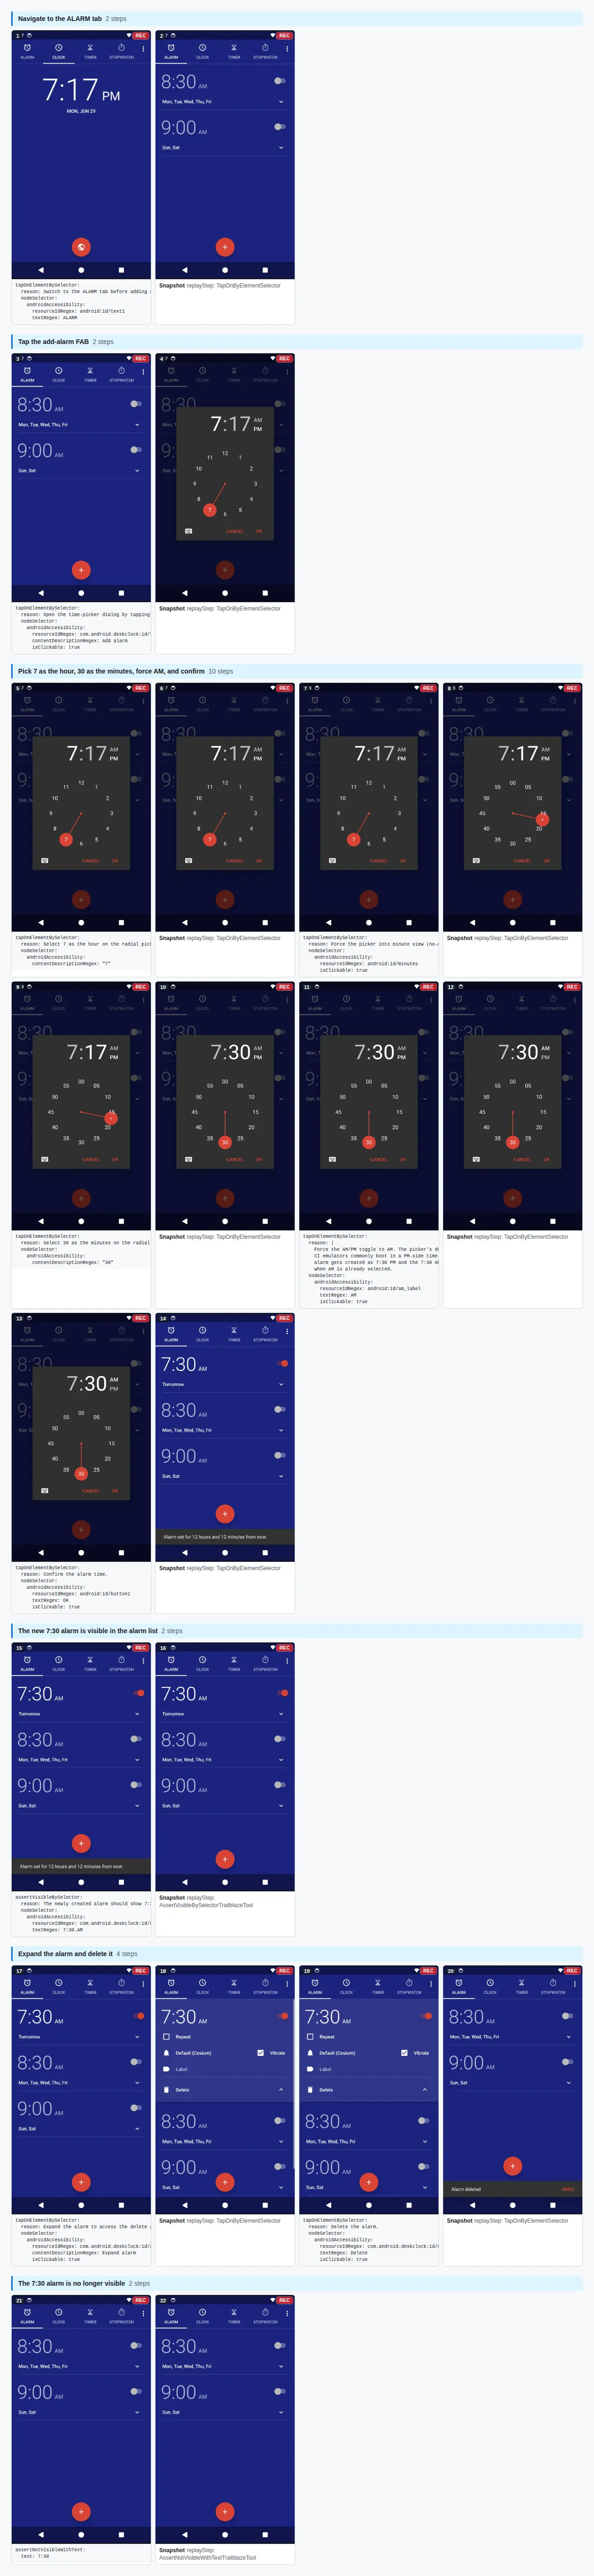
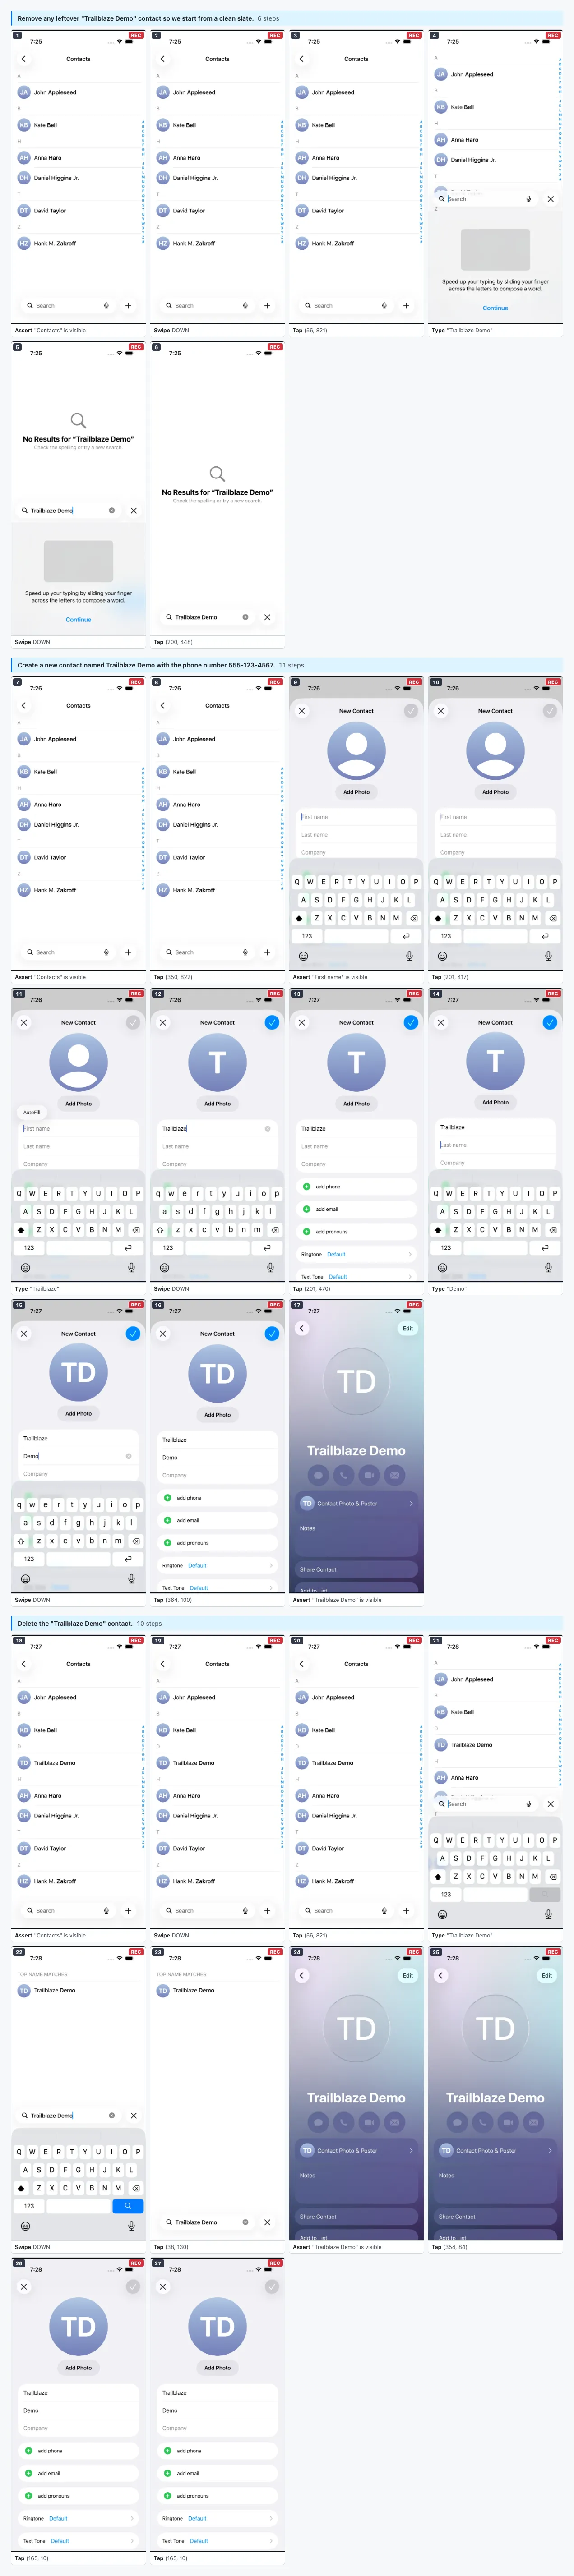
- Storyboard — a single-frame grid tiling every step’s screenshot, labeled with the
tool that ran. A glance-overview of the whole flow. (
trailblaze report --storyboard) - Timeline (animated WebP) — the report’s timeline autoplay, scrubbing through each
step with its labels and annotations. The animated walkthrough.
(
trailblaze report --webp) - Interactive report — the full self-contained HTML report: per-step screenshots, view-hierarchy snapshots, recorded tool calls, and (when an LLM was involved) the transcript. This is the same Trace Viewer surface the desktop app shows.
These are live artifacts
The WebP and storyboard below link through to the full interactive HTML report — click either image to open it. The HTML report is a single file you can download, open offline, or attach to a PR; embedding it inline doesn’t do it justice, so the animations link out to the real thing.
Set an alarm (Android)
A recorded Android trail driving the system Clock app to set a 7:30 AM alarm, replayed on
an emulator via Trailblaze’s host-RPC Android driver — no LLM at replay time. Source:
trails/clock/set-alarm-730am.
Storyboard
Timeline
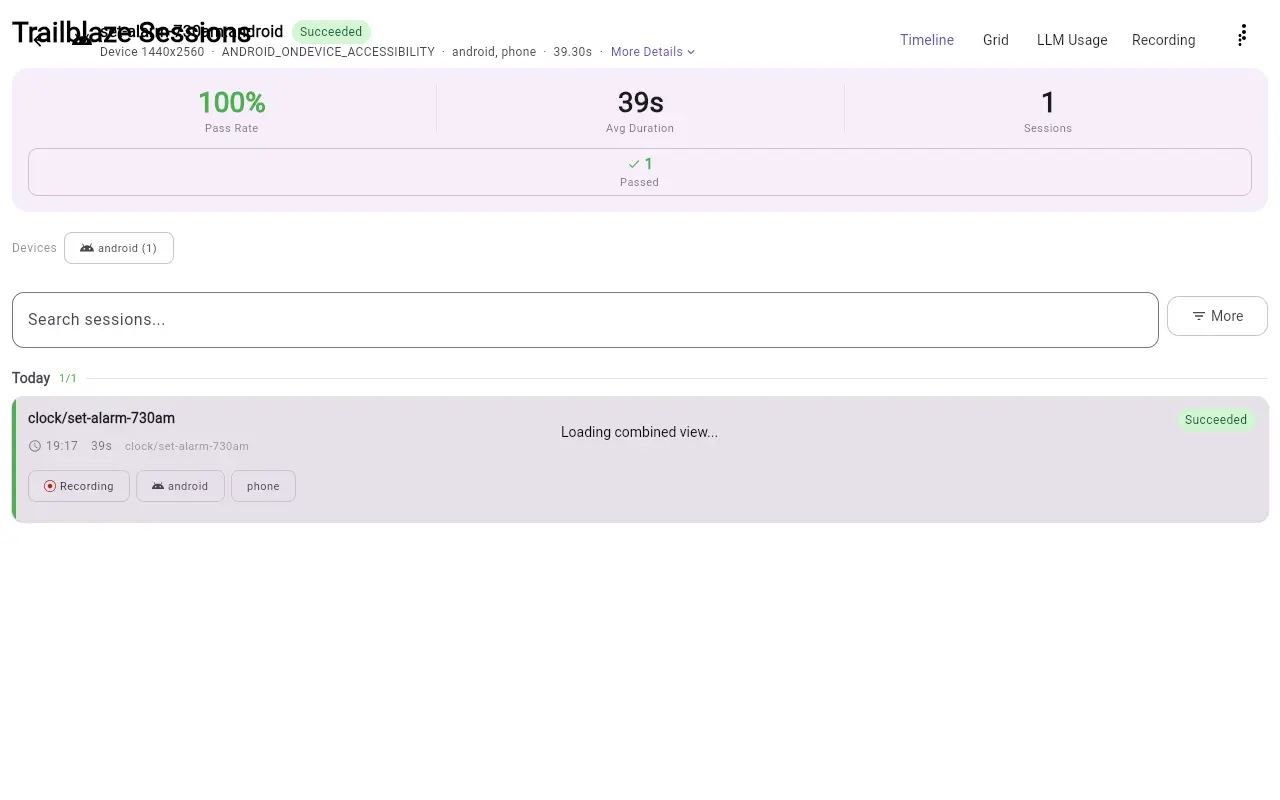
Open the full interactive report →
Contacts (iOS)
A recorded iOS trail driving the system Contacts app through a full create→verify→delete
lifecycle — creating a “Trailblaze Demo” contact with a phone number, confirming it landed
in the list, then deleting it — replayed on an iOS simulator with no LLM at replay time.
Source: trails/ios-contacts/test-create-then-delete.
Storyboard
Timeline
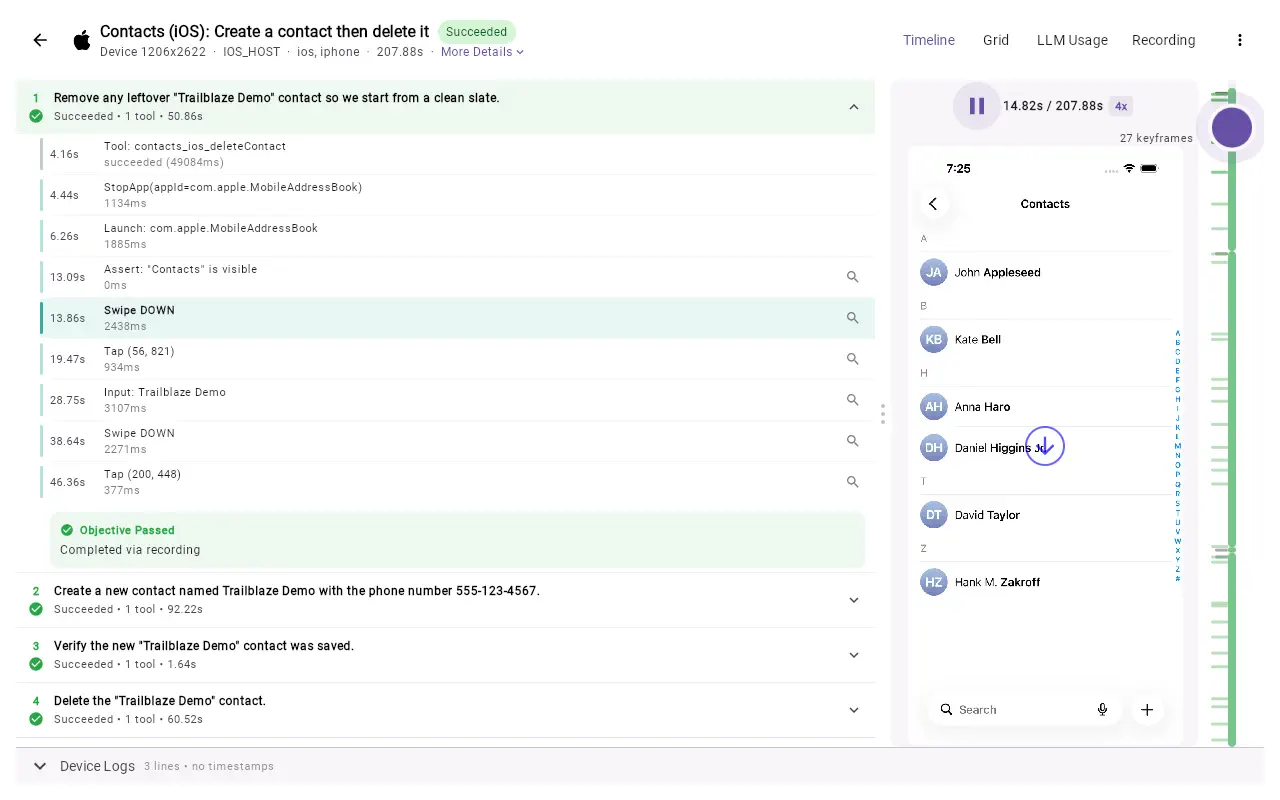
Open the full interactive report →
Wikipedia (web)
A recorded web trail driven through Playwright against live en.wikipedia.org — no
Android emulator or iOS simulator required, and no LLM at replay time. Source:
examples/wikipedia.
Storyboard

Timeline
Open the full interactive report →
Want this for your own app? Every trailblaze run produces a session you can export
the same way — see the CLI reference for trailblaze report
and its --storyboard / --webp / --gif / --video flags.