Observability with Laminar
This tutorial covers how to integrate goose with Laminar to trace your goose sessions and understand how the agent is performing.
What is Laminar
Laminar is an open-source observability platform purpose-built for AI agents. It traces LLM calls, tool execution, and custom functions so you can debug, evaluate, and improve agent behavior.
Why Laminar for goose
- High-signal traces for LLM calls, tools, and sub-agents.
- Replay any span in the Playground to compare prompts and models.
- Build datasets from production traces and run evaluations.
- Analyze trace patterns with natural language queries and dashboards.
Set up Laminar
Sign up for Laminar Cloud at laminar.sh or self-host Laminar from the open-source repo. Grab your project API key.
Configure goose to export OTLP to Laminar
goose exports OpenTelemetry data over OTLP/HTTP. Point the exporter to Laminar and provide your API key as an authorization header.
Laminar Cloud
export LMNR_PROJECT_API_KEY=lmnr_proj_...
export OTEL_EXPORTER_OTLP_ENDPOINT="https://api.lmnr.ai"
export OTEL_EXPORTER_OTLP_HEADERS="authorization=Bearer ${LMNR_PROJECT_API_KEY}"
export OTEL_EXPORTER_OTLP_TIMEOUT=10000
Self-hosted Laminar
export LMNR_PROJECT_API_KEY=lmnr_proj_...
export OTEL_EXPORTER_OTLP_ENDPOINT="http://localhost:8000"
export OTEL_EXPORTER_OTLP_HEADERS="authorization=Bearer ${LMNR_PROJECT_API_KEY}"
If your self-hosted instance does not require auth, you can omit OTEL_EXPORTER_OTLP_HEADERS.
If you do not see traces, try setting the endpoint to the explicit OTLP path, such as https://api.lmnr.ai/v1/traces or http://localhost:8000/v1/traces.
Run goose with Laminar enabled
Start goose normally. With the OTLP environment variables set, Laminar will capture traces of your goose sessions and tool execution.
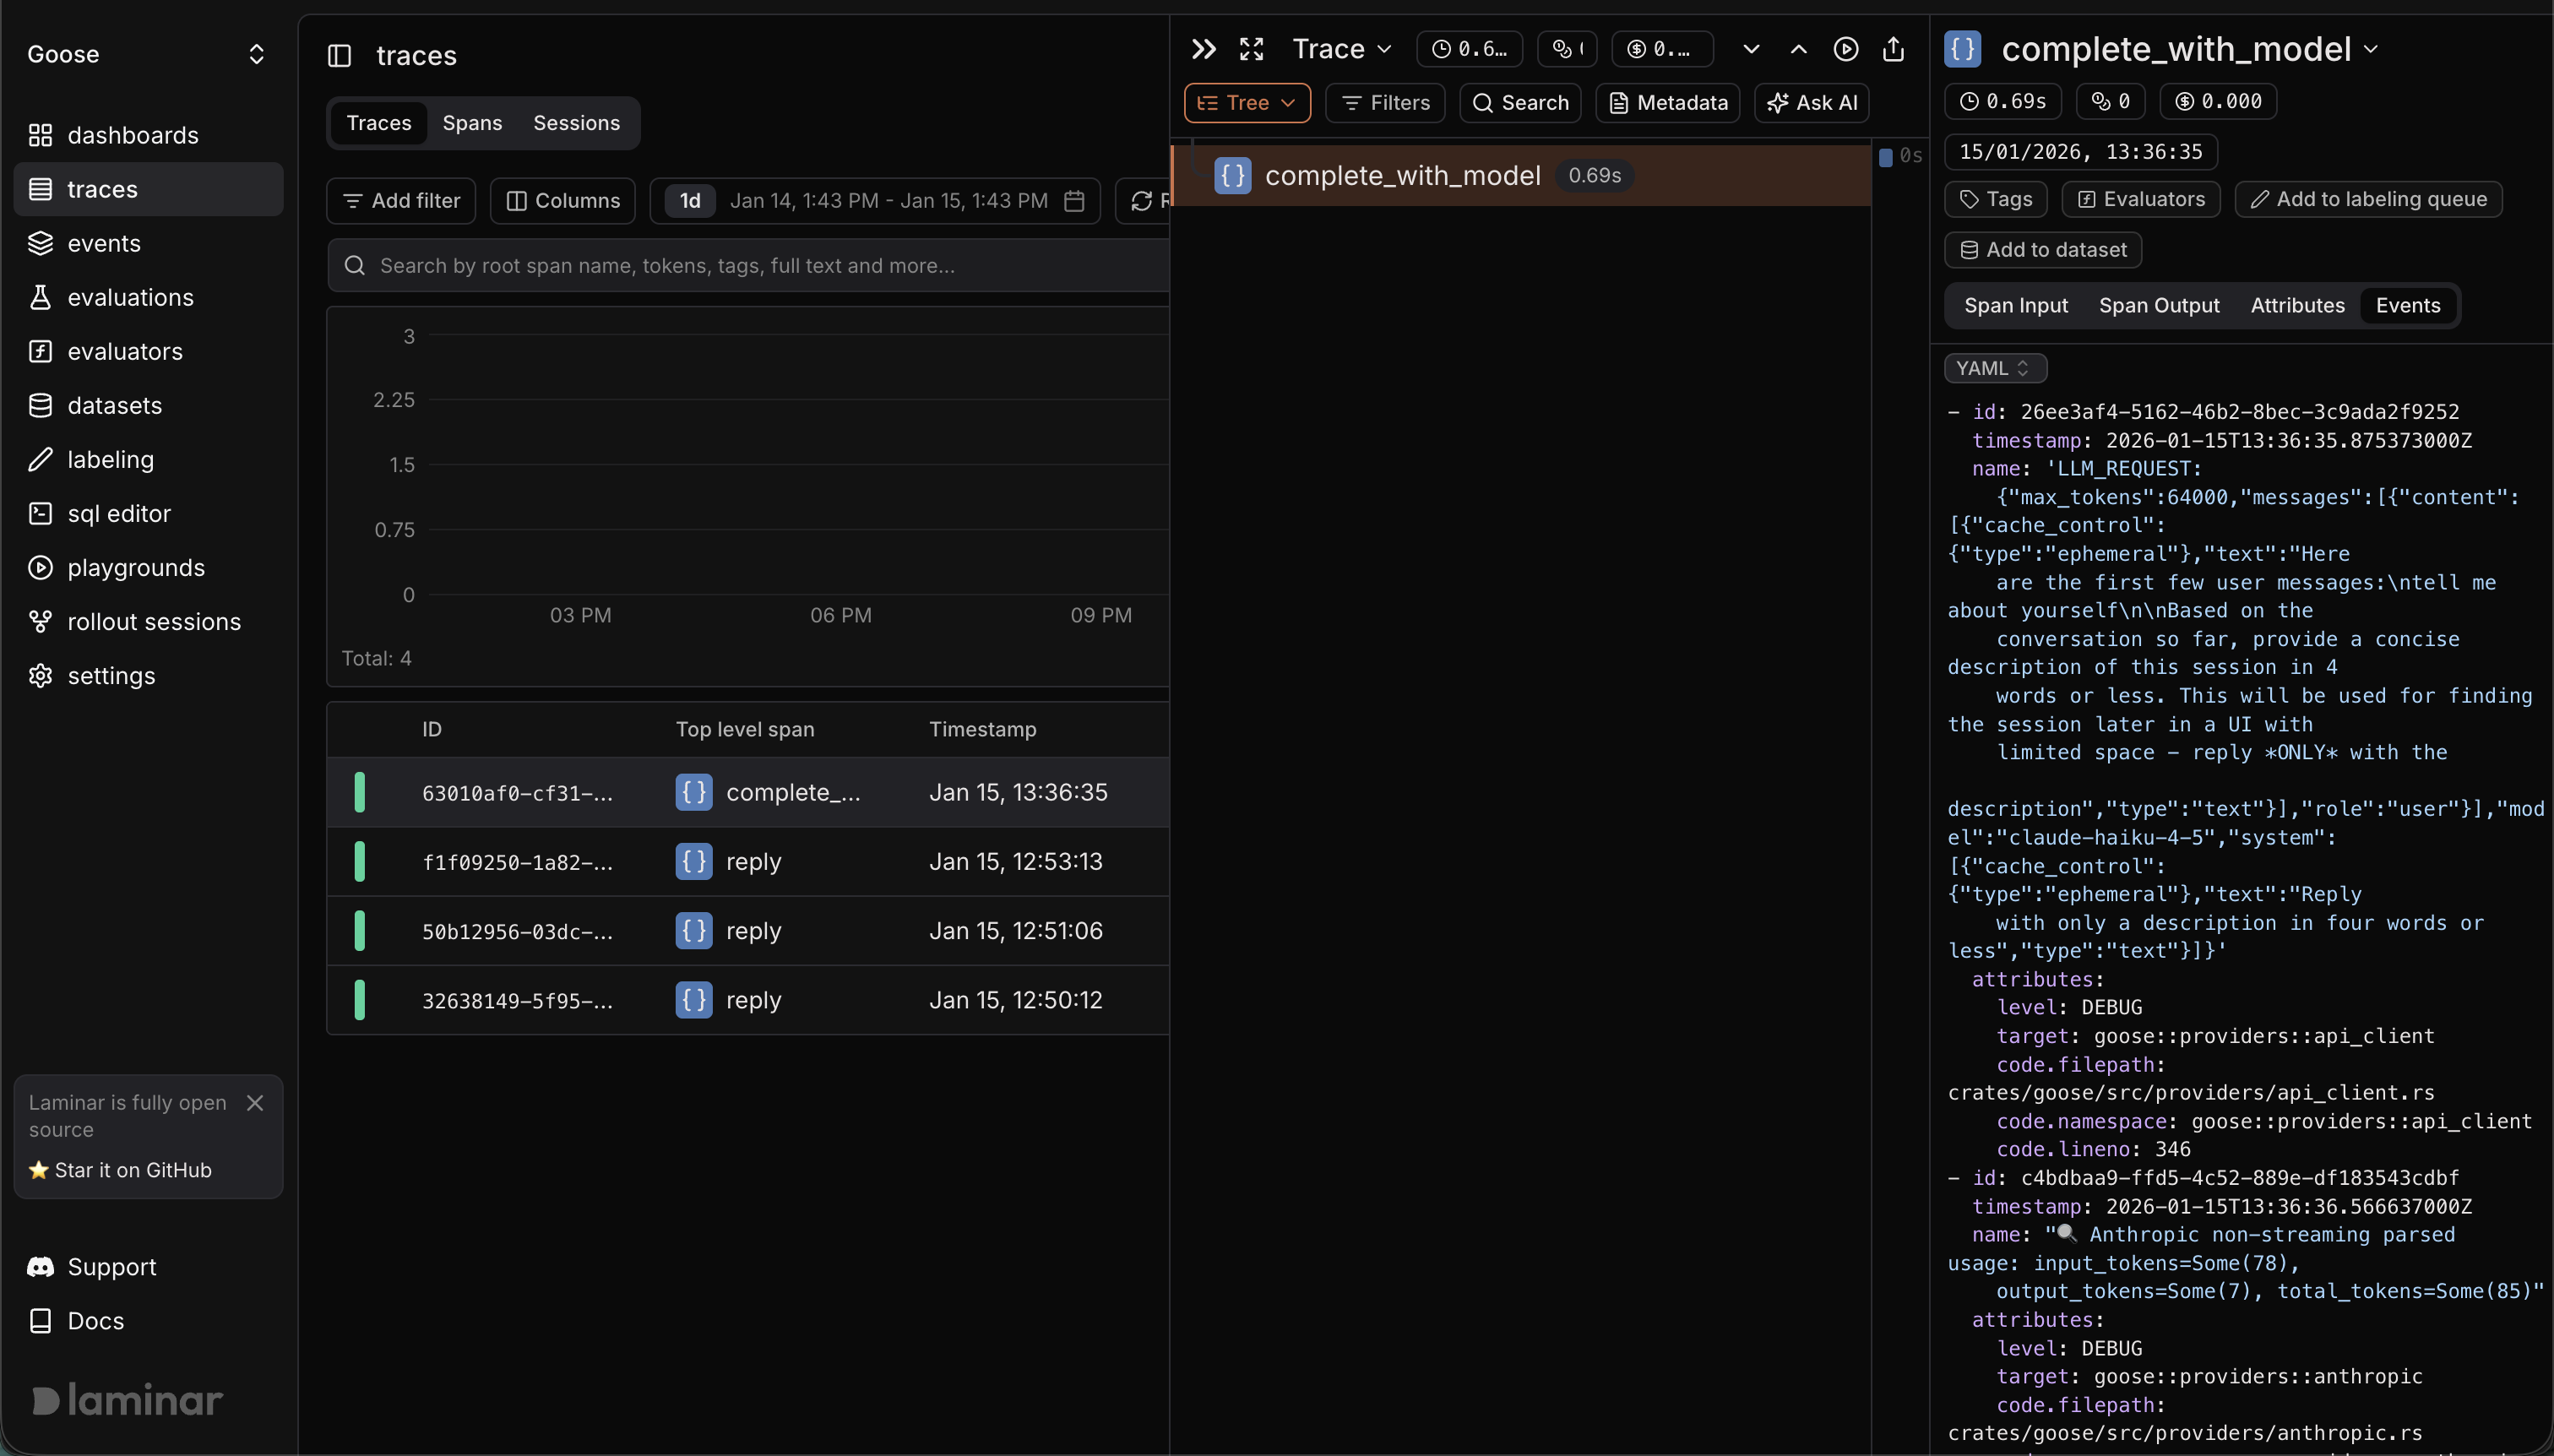
Example trace (public) in Laminar