Observability with MLflow
This tutorial covers how to integrate goose with MLflow to trace your goose sessions and understand how the agent is performing.
What is MLflow
MLflow is an open-source platform for managing the end-to-end machine learning and AI lifecycle. MLflow Tracing provides detailed observability into AI agent execution, capturing LLM calls, tool usage, and agent decisions with a rich visualization UI.
Why MLflow for goose
- Detailed trace visualization: Inspect every LLM call, tool execution, and agent decision in a hierarchical trace view.
- Token usage tracking: Monitor input/output token counts and costs across sessions.
- Evaluation framework: Evaluate agent outputs using built-in LLM judges and custom scorers.
- Prompt management: Version and manage prompts used across your AI applications.
- Open source: Fully open-source with no vendor lock-in, self-host anywhere.
Set up MLflow
Install MLflow and start the tracking server:
pip install mlflow
mlflow server --port 5000
The MLflow UI will be available at http://localhost:5000.
For production use, configure a SQL backend store (PostgreSQL, MySQL) instead of the default SQLite. See the MLflow documentation for details.
Configure goose to export OTLP to MLflow
goose exports OpenTelemetry data over OTLP/HTTP. Point the exporter to MLflow's OTLP endpoint:
export OTEL_EXPORTER_OTLP_ENDPOINT="http://localhost:5000"
export OTEL_EXPORTER_OTLP_HEADERS="x-mlflow-experiment-id=0"
The x-mlflow-experiment-id header specifies which MLflow experiment to log traces to. Use 0 for the default experiment, or create a dedicated experiment:
pip install mlflow
mlflow experiments create --experiment-name "goose-traces"
# Use the returned experiment ID in the header
To export only traces (disable metrics and logs export):
export OTEL_TRACES_EXPORTER=otlp
export OTEL_METRICS_EXPORTER=none
export OTEL_LOGS_EXPORTER=none
Run goose with MLflow enabled
Start goose normally. With the OTLP environment variables set, goose will automatically export traces to MLflow:
goose session
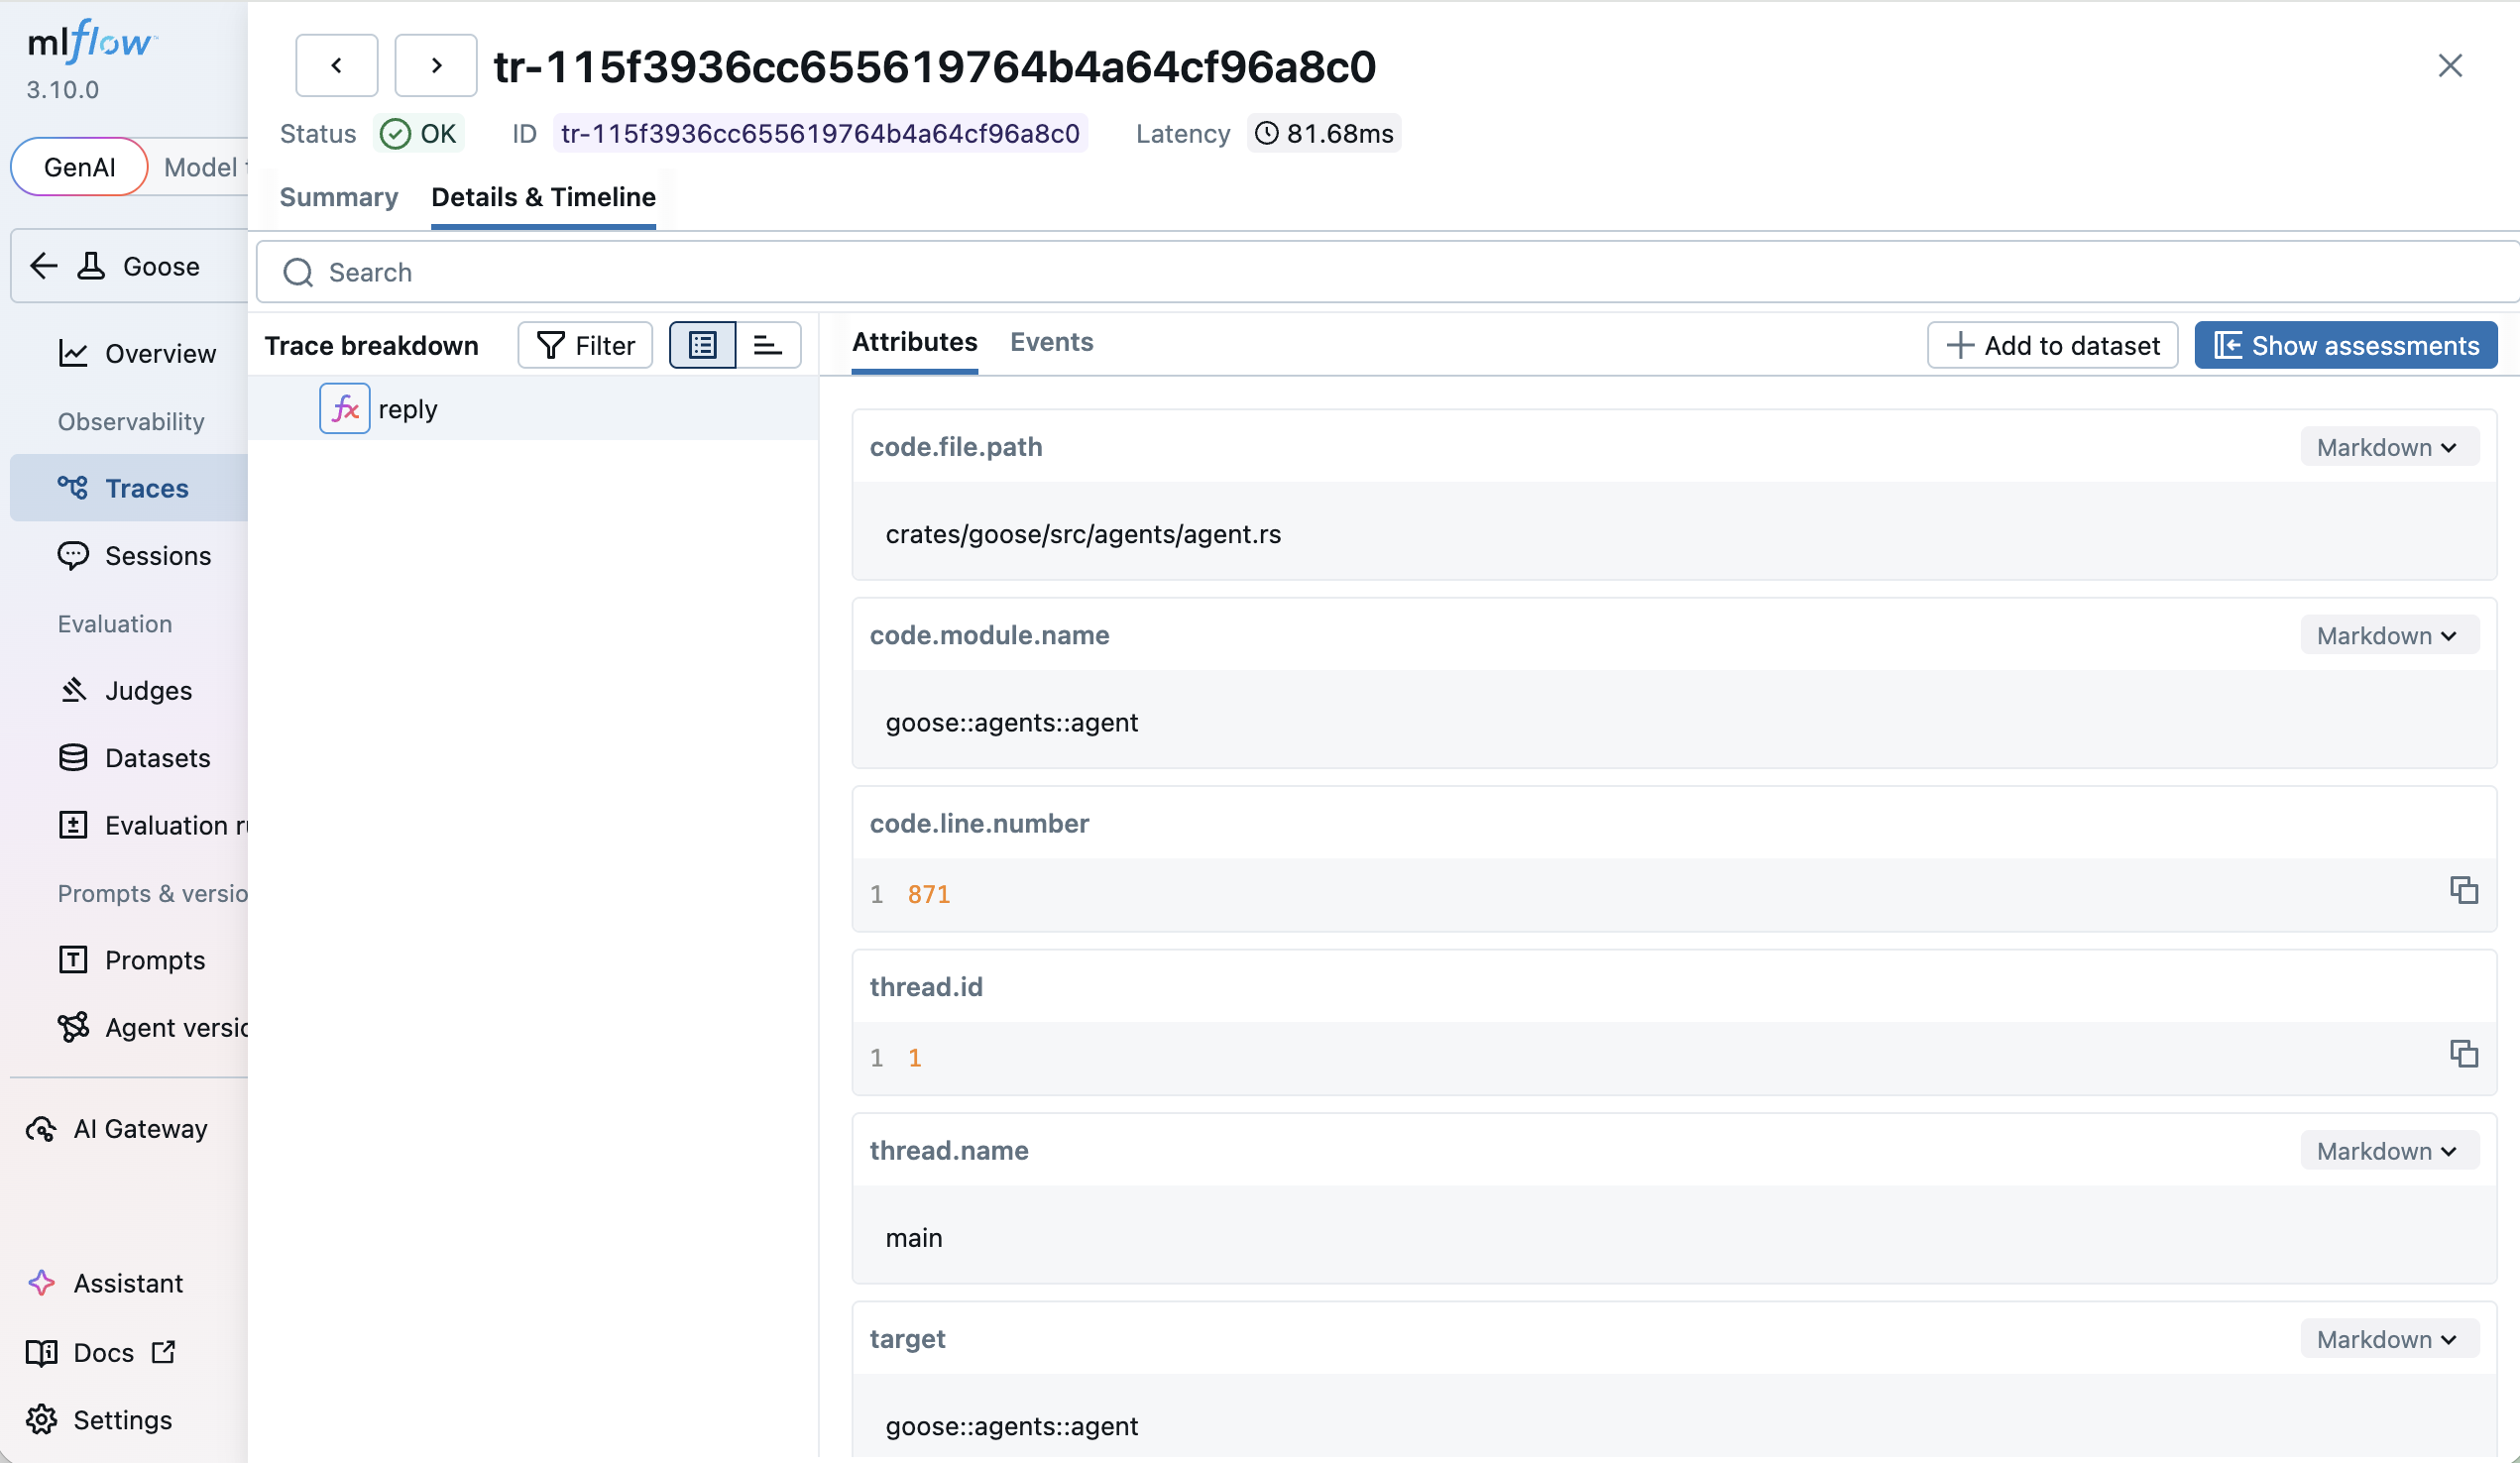
Open the MLflow UI at http://localhost:5000 and navigate to the Traces tab to see detailed traces of your goose session, including LLM calls, tool executions, and token usage.